
- A lot of people will overreact during market corrections for one simple reason – they don’t have a plan in place.
- Always tell people that the worst time to discover your risk profile is when you can’t afford to discover it.
- We all want the perfect portfolio. That’s the portfolio that captures all the upside and none of the downside. >> News flash – that thing doesn’t exist.
Markets went heavily down (correction or bear market ?) late January. They are not catastrophic numbers, but they are fairly sizable given that we are only in the beginning of the year 2022.
At this falling rate, the Nasdaq will be at $0 by July. Just kidding. That is not how that works. But still, it is an uncomfortable environment. So what should we do? Here’s a quick check list followed by some tips to identify whether we are in a correction or a bear market:
1. Revisit your financial plan and goals.
A lot of people will overreact during market corrections for one simple reason – they don’t have a plan in place. All asset allocation should start with a simple financial plan so you create goals and time horizons for specific assets.
For the the average investor we would advise of simple bucketing strategies using ETFs because they create behaviorally robust and streamlined asset/liability matching portfolios.
What that means in short is, you want to have specific buckets for specific time horizons to match your future liabilities. For instance, everyone needs a liquidity bucket for emergencies, home down payment, etc. And everyone has medium-term liabilities for more uncertain future liabilities like kids tuition, car purchases, etc. And then we all have long-term buckets like retirement and long-term health needs. Creating time horizons for your assets will help you stomach the probability that that asset will be there in full when you need it to be there.
At any rate, you need to establish a plan and the worst time to establish your plan is after the market falls and you realize you needed the plan years ago.
The worst time to discover your risk profile is when you can’t afford to discover it. This too often happens when the market is spiraling lower and people panic. People move to cash because cash makes the pain stop. If you don’t know your risk profile the market will teach it to you. Do not wait for that moment. Instead, assess your max pain point before you get there.
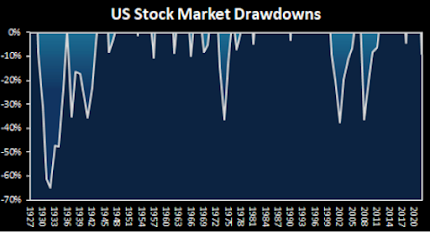
The best way to do this is to ask yourself how you’d feel if your portfolio fell 20% over the course of a calendar year. And then assume it’s going to fall another 20% the following calendar year.
At this point, your portfolio is down 36% so you need to ask yourself how you’ll feel when it falls another 20% in year 3. This brings you to a total drawdown of 49%. This is essentially what happened in the 1970s and early 2000s. It’s not unheard of by any means even though it is a distant memory.
Now, everyone knows how to answer the question “what do you do in this environment?” Everyone says buy more or sit tight. But when you’re in the throes of that 49% downturn you will, with near certainty, question every emotion you’re having. You will, with certainty, say “what if it’s different this time”. And you will be tempted to sell to make the pain stop.
Do this exercise now. Put yourself in those emotions now so you don’t discover them later.
3. Remember that perfect is the enemy of the good.
We all want the perfect portfolio. That’s the portfolio that captures all the upside and none of the downside. News flash – that thing doesn’t exist. And no matter how much you look for it you will just waste money on taxes and fees the harder you try.
You aren’t going to capture all the upside with all the downside protection of cash. Everyone wants to hate on bonds and cash in an environment like today. But that’s mainly because they’ve forgotten what it feels like when stocks go down for multiple years in a row (something bonds and cash do not do).
The point is, implement the portfolio you need, not the portfolio you want. By setting realistic expectations and implementing the portfolio you need you will likely give up a lot of potential upside while implementing a portfolio that is behaviorally robust and therefore likely to perform better than the counterfactual where you chase the returns without knowing you are chasing risk.
4. Talk about it.
People don’t like to talk about money. Or, they like to talk about money when things are good, but hate to talk about money when things are bad. Own your mistakes. Talk about them. Learn from them.
There’s nothing wrong with talking about your mistakes, getting second opinions and having an open discourse about how you are feeling and what you are doing. It’s all part of the process of learning to deal with the emotional rollercoaster of the markets.
That is wise to complete your experience and reasoning by questioning professionals in whom you trust and check with him (them) the optimal solution for you (as everyone has different needs and risk levels).
At Investlogic we are happy to help you to find the best solution FOR YOURSELF !
Super Bubble and Bear Markets
JEREMY GRANTHAM previously posted the following chart of
40-years of market bubbles. During the inflation phase, each got
rationalized that “this time is different.”
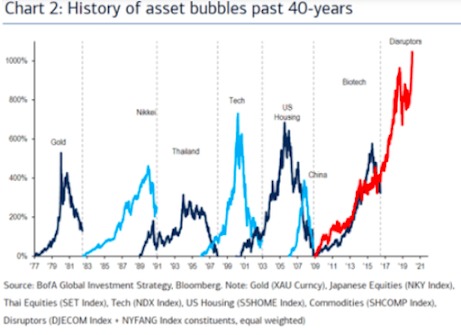
“The penultimate phase of major bubbles is characterized by a “blow-off” which is an accelerating rate of stock price growth to two or three times the average of the preceding bull market. This pattern shows as clearly as any of history’s other great superbubbles in 2020 (see below Exhibit 4).”

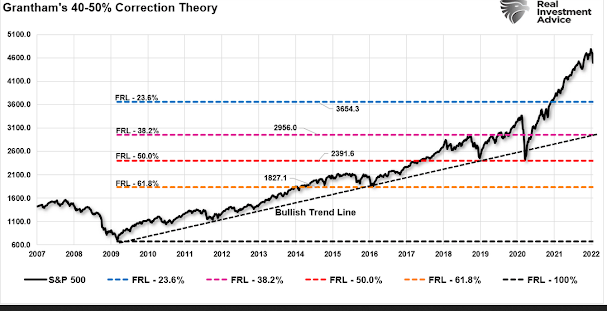
Grantham who has been bearish for months did not hesitate to announce couple of days ago that the SUPERBUBBLE had just exploded… And that the loss of capital that will follow could reach 35’000 billions – We don’t even know what that means. He thinks that the irrational behavior of many investors will lead to a total collapse in all asset classes… the possibility of a 40-50% contraction to revert the massive extension from the long-term growth trend is highly.
The two most important levels for market watchers, given Grantham’s view of a “mean reverting event,” are the 38.2% and 50% retracement levels. The 38.2% level intersects the running support trendline from 2009. The 50% retracement level aligns with the lows from 2018 and March 2020.
Should those two support levels fail, the market will likely search for a bottom at the 61.8% retracement level at the 2015-2016 lows.
That can’t happen, you say?
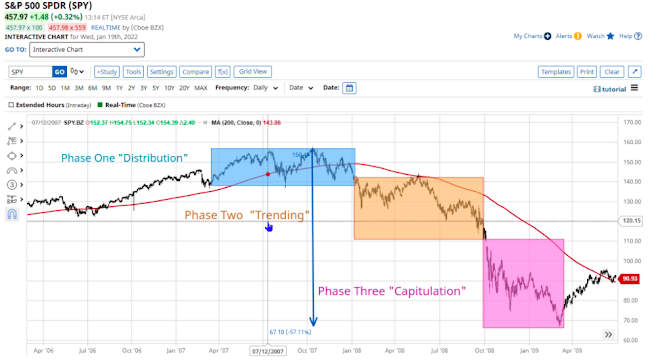
A Bear Market Anatomy
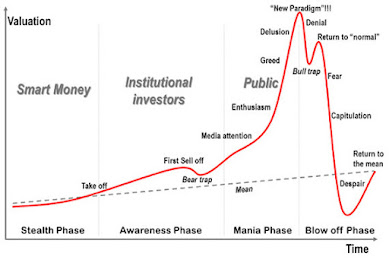
There are three principal phases of a bull market: the first is represented by reviving confidence in the future of business; the second is the response of stock prices to the known improvement in corporate earnings, and the third is the period when speculation is rampant - a period when stocks are advanced on hopes and expectations.
There are
three principal phases of a bear market: the first represents the abandonment of the hopes upon which stocks were purchased at inflated
prices; the second reflects selling due to decreased business and
earnings, and the third is caused by distress selling of sound
securities, regardless of their value, by those who must find a cash
market for at least a portion of their assets.
- Robert Rhea, The Dow Theory, 1932
What Defines A Bear Market
To answer that question, let’s agree on a basic definition.
- A bull market is when the price of the market is trending higher over a long-term period.
- A bear market is when the previous postive-trend breaks, and prices trend lower.
The chart below provides a visual of the distinction. When looking at price “trends,” the difference becomes apparent and valuable.
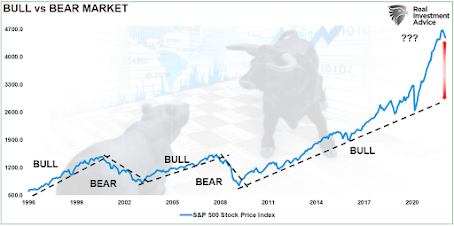
The distinction is also essential to understanding the difference between “corrections” and “bear markets”.
“Corrections” generally occur over short time frames, do not break the prevailing trend in prices, and are quickly resolved by markets reversing to new highs.
“Bear Markets” tend to be long-term affairs where prices grind sideways or lower over several months as valuations are reverted.
The price decline in March 2020 was unusually swift using monthly closing data. However, that decline did not break the long-term bullish trend and quickly reversed to new highs, suggesting it was a “correction.”
We are here to accompany you along the way.
Aucun commentaire:
Enregistrer un commentaire